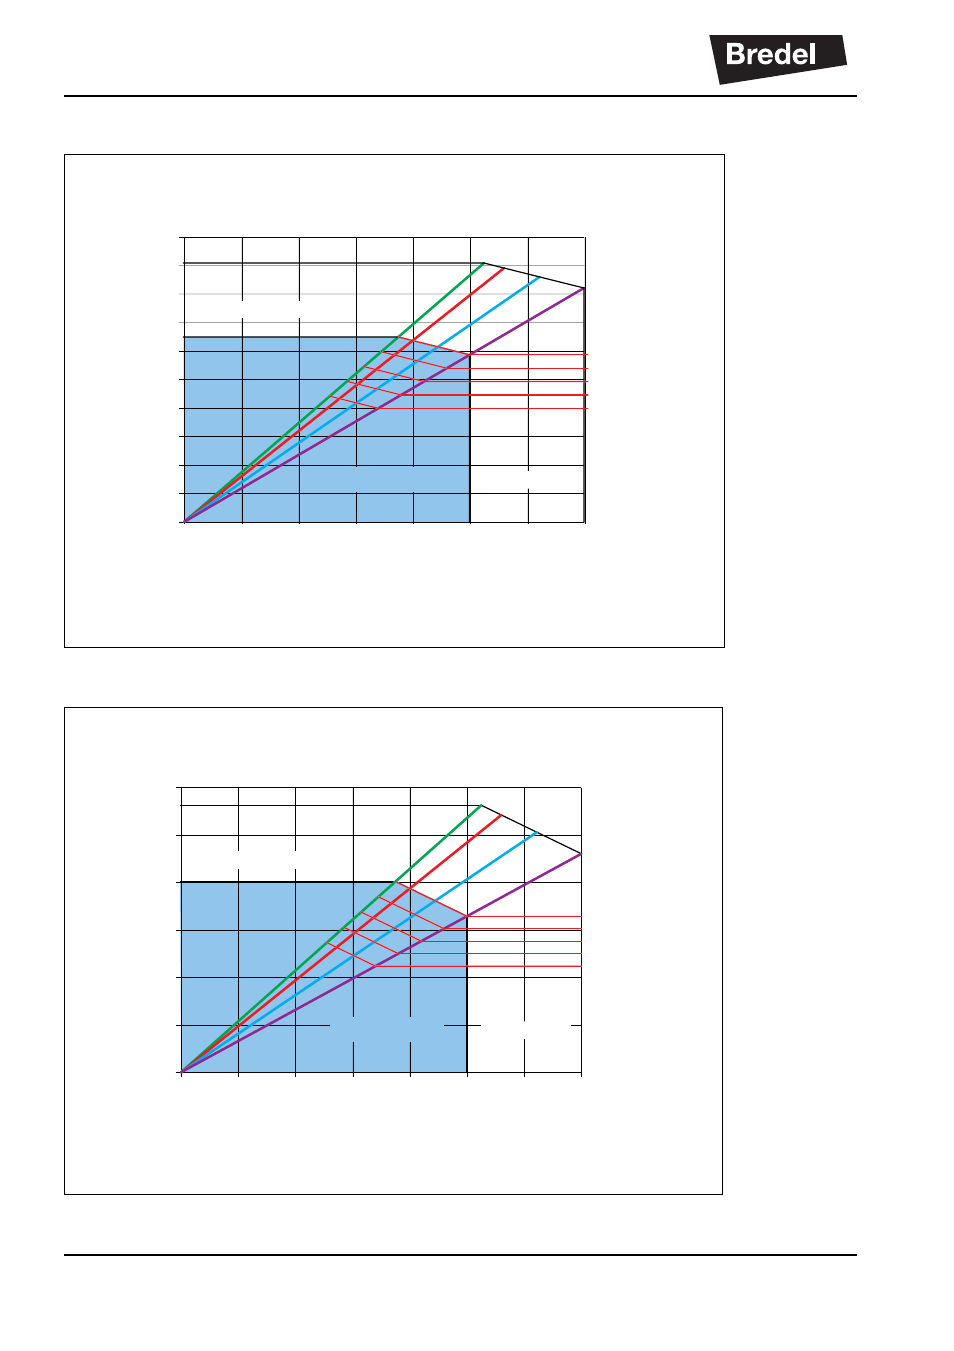
1 wykres wydajności apex10, 2 wykres wydajności apex15 – Watson-Marlow APEX10 Instrukcja Obsługi
Strona 32
Advertising

Zasada dzia
łania
32
7.3.1
Wykres wydajno
ści APEX10:
7.3.2
Wykres wydajno
ści APEX15:
0.00
0
20
40
40
50
60
70
80
60
80
100
120
140
0
55
110
165
220
275
330
385
0.05
0.10
0.15
0.20
0.25
0.30
0.35
0.40
0.45
0.50
Pump Speed [rpm]
Capacity [L/h]
Required Motor Power [kW]
0 kP
a
300 kP
a
600 kP
a
800 kP
a
Intermittent Duty
Continuous Duty
100 kPa =1 bar
Product
temperature
(°C)
0.00
0
20
40
60
80
100
120
140
0
110
220
330
440
550
660
770
0.10
0.20
0.30
0.40
0.50
0.60
Pump Speed [rpm]
Capacity [L/h]
Required Motor Power [kW]
0 kP
a
300 kP
a
600 kP
a
800 kP
a
Intermittent Duty
Product
temperature
(°C)
40
50
60
70
80
Continuous Duty
100 kPa =1 bar
Advertising